

Outlandish has spent much of lockdown developing a tool that tracks Covid-19 samples for the Wellcome Sanger Institute. Sanger carry out the majority of genomic analysis of Covid samples in the UK and have made the UK a world leader in this sort of analysis as well as analysis of other diseases such as malaria.
The tool we helped build – named CoTrack – allows scientists and business managers to track samples as they progress through the analysis pipeline – from being first delivered and stored to eventually having their genomes sequenced. This makes it easier to prioritise analysis in outbreak hotspots and where it is suspected that a new variant might have taken hold.
Much of the work done on this app to manage Covid samples will be reused and adapted by different parts of Sanger – first by the MalariaGen project which is using genetic analysis to help combat malaria drug resistance.
To support the internal Sanger development team we carried out a number of different streams of work:
UI Toolkit
Because Sanger aims to use the same components in multiple applications we abstracted much of the complexity of the frontend into a UI Toolkit. The toolkit is based on visual designs that we created for a previous project we built for Sanger – an open data portal containing genomic data about malaria samples. The toolkit is built using frontend javascript framework VueJS which is comparable to React and Angular. The toolkit contains components that you need to build different types of sample tracking apps including generic components such as buttons and avatars, and also much more specialised components such as multi-filters and “virtually scrolling” tables that handle millions of rows. In some ways it’s quite like other UI frameworks such as Bootstrap or Foundation but with much more specialised components focussed more on a specific type of data app than general web development.
Data UI design
We managed much of the process of interviewing scientists about their requirements, wireframing the potential solutions (in Whimsical), designing high-fidelity prototypes (in Figma) and user-testing the prototypes before they were built. This workflow allowed the developers to focus on building features that they knew were needed, and on working out how all the data was supposed to fit together.
Data exploration
As with many of our projects, there was a lot of data and no clear instructions on how it was all supposed to fit together. To make things much more difficult, most of the people who did know how the data was supposed to fit together were extremely busy trying to update their processes to handle ten times as many samples as they normally could and buying all the fridges and robots and test tubes that were needed to make that possible. We used a variety of tools including Jupyter Notebooks, Pandas, plotly and plain old SQL to explore the various Sanger data warehouses and online databases to understand how initial patient samples mapped through the various stages of analysis.
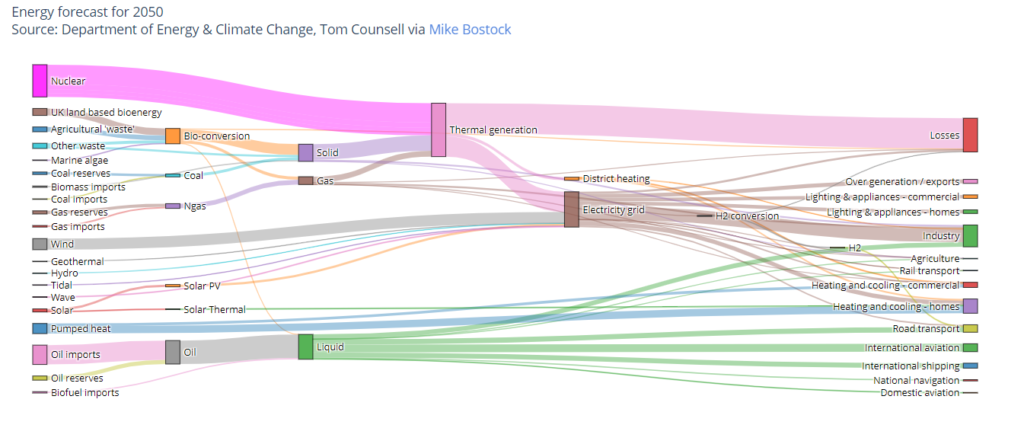
One of the less common visualisation techniques we used to understand the data were “sankey” diagrams which are fairly easy to create using plotly in Jupyter Notebooks:
We tend not to use these for public-facing applications or websites because people are not familiar with them and are therefore prone to misinterpreting them even though they look nice. Our clients always seem to be very keen on radar plots and sunburst diagrams, which we also tend to stay away from for the same reasons, but that’s another blog. Anyway, in this case the sankey diagrams helped us understand how the data appeared to be suggesting that samples were flowing around the various different parts of the analysis pipelines – often seeming to go through the same step many times. What this was actually revealing was that the relationship between the different types of identifiers was not what we’d been led to believe – they were many-to-many and one-to-many relationships instead of one-to-one relationships. This sort of problem is common in data science and somewhere between good fun and hair-rendingly awful to discover and fix.
Backend development
The project gave our Python-loving developers a chance to flex their love for the “pythonic way”. We don’t tend to use Python for applications that we’re going to support for years to come because only a subset of our developers use it, whilst all of our developers use Javascript/Node and PHP. We take the need to keep apps running smoothly seriously and so we don’t want to be overly reliant on one or two people, even if they quite like the idea of building the app in their favourite/latest language. As this was an app that Sanger’s own internal team were going to end up supporting it made sense to do it in their favoured language/stack and so we ended up helping build the app with a Python/Flask backend and an Apache Airflow-powered data pipeline to extract, transform and load (ETL) the data from the various data sources into a format more suitable for consumption for our app.
Design Sprint
Much of the work we did on the covid sample tracking app was informed by a design sprint we’d previously carried out for a Malaria sample tracking app, before Covid 19 existed. The design sprint involved an intensive process of working with scientists, lab staff and Sanger product managers to identify the workflows, tools and common problems encountered with sample tracking. After conducting the user interviews a team of developers, designers and product managers from Outlandish created wireframes and clickable prototypes of potential solutions and tested these with the Sanger staff and partners, creating many iterations and improvements of the month long design process. This meant that when we started the covid project we already had a lot of lessons learned and could hit the ground running.
Aside: Which programming language to use?
We’re currently debating whether to adopt Python more widely within Outlandish. In the last few years it’s become extremely popular – much more so than PHP which was once the leading back-end programming language of the web.
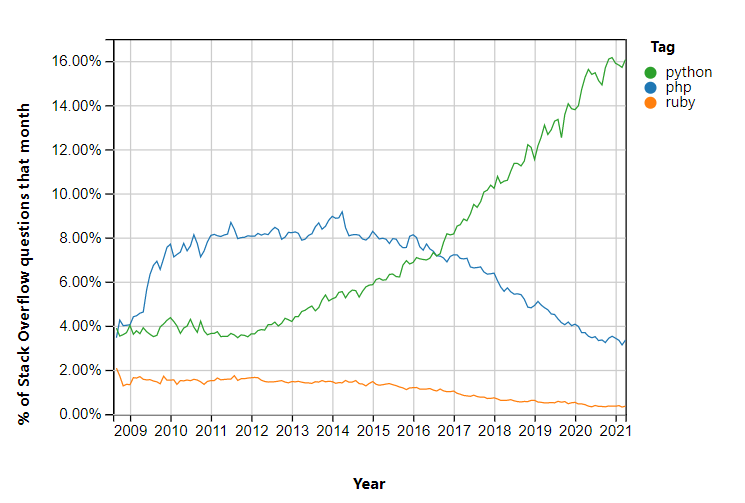
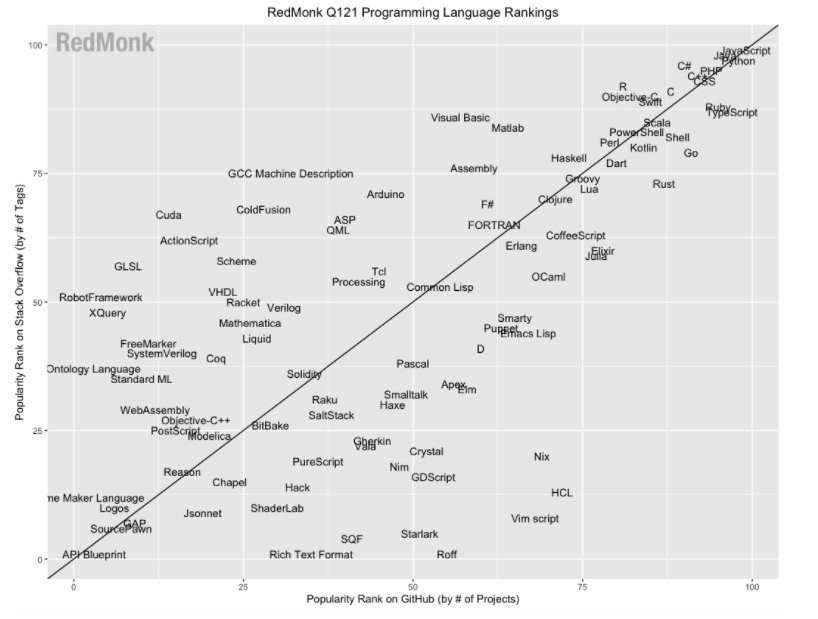
According to the awesome Stack Overflow trends tool, Python overtook PHP in terms of how many questions developers are asking about it a few years ago and the trend seems to be getting ever more extreme. Of course, this is only one very limited measure and other analyses – such as that by developer analysts RedMonk – suggest that the difference is much narrower:
Looking at numbers of active installs for web applications, Laravel (the most popular MVC PHP framework) has a lot more installs than Django (the Python equivalent) but the django sites tend to get more traffic. When it comes to websites (primarily serving content, as opposed to applications) there is no comparison – all the major CMSs are written in PHP: WordPress, Drupal, CraftCMS and Joomla have several orders of magnitude more installs and visitors that their Python equivalents such as Django CMS, Mezzanine and Wagtail.
Broadly it’s a win still for PHP when making web applications and definitely for websites, but when it comes to exploring and processing data Python’s probably the winner. Jupyter and Pandas (and Beautiful Soup, PyTorch and FastAI which we use on other projects) are amazing tools that have no real equivalent in PHP-land.
There’s a lot to be said for choosing a boring technology and not much to be said for building your next project in chicken, brainfuck, Mongo (no link, we don’t want to encourage you) or even Mostawesomeprogramminglanguage, despite the name, but Python is probably boring enough for us to add to our “official stack” and we do a lot of it so we’d probably better just ante-up and support it fully.
Anyway, whatever stack you’re stuck with and whatever data you’re dealing with give us a call (0800 999 4355) or email us (hello@outlandish.com) if you want to chat about getting some help on your project. If we’re not the right people we’ll point you in the direction of some other nice people who can help.


