

The Brief
- To build a data analytics tool that effectively communicates vital information regarding global water, sanitation and hygiene to world experts
- To redesign UNICEF and the World Health Organization’s (WHO) Joint Monitoring Programme website, in collaboration with Agile Collective
- To manage the project and the team, delivering the finished tool in just 4 weeks
The Client
UNICEF and the WHO co-run the United Nations’ Joint Monitoring Programme (JMP) for water, sanitation and hygiene (WASH).
The programme gathers data from almost every country in the world. The accompanying analysis is used by UN agencies, NGOs, donors, journalists and academics. Data provided by the JMP is vital for global decision making and raising awareness.
The existing JMP website was failing to guide users towards the relevant data, updating was becoming unwieldy, and the site required an overhaul for reasons of security and compatibility with new devices.
We were commissioned to build an analysis tool that would handle all current and future data, while our collaborators and fellow CoTech member Agile Collective took responsibility for the Drupal website, design and content.

Our Solution
We worked with UNICEF and the WHO to better understand their data and user groups, before designing a series of report types and data visualisations.
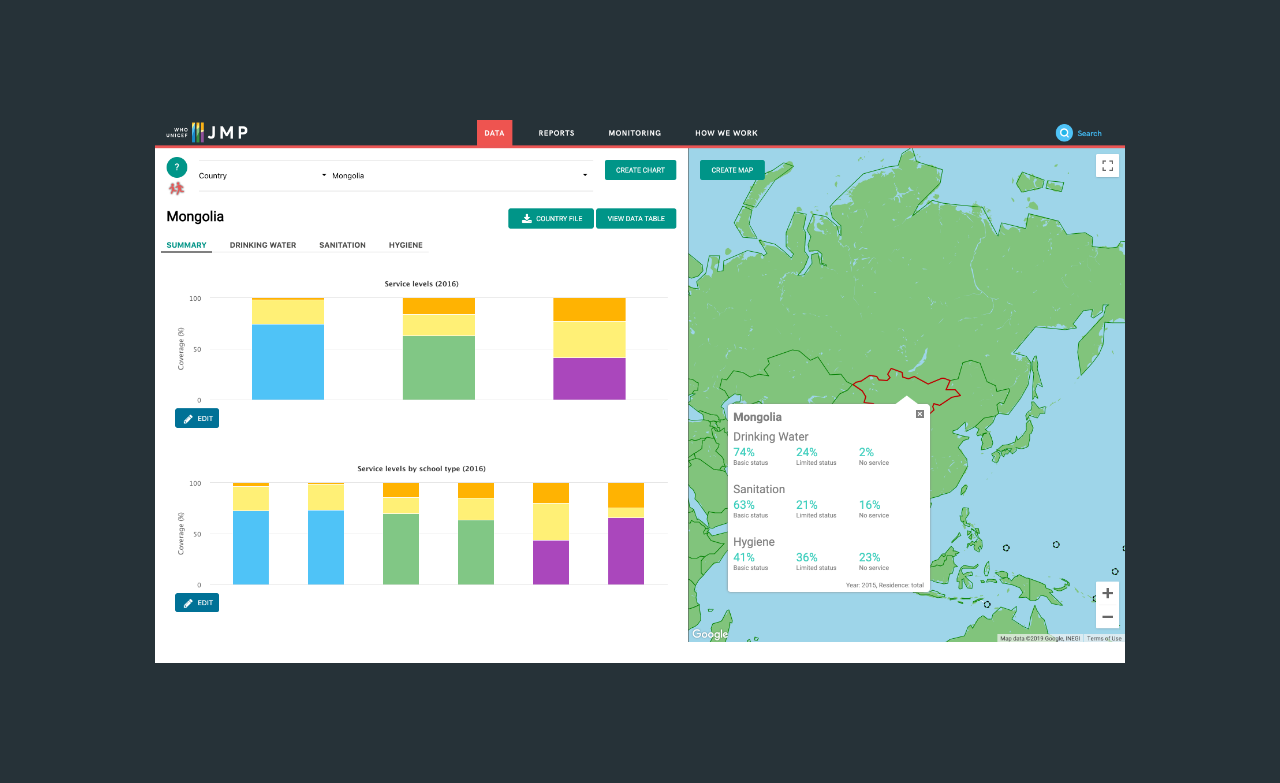
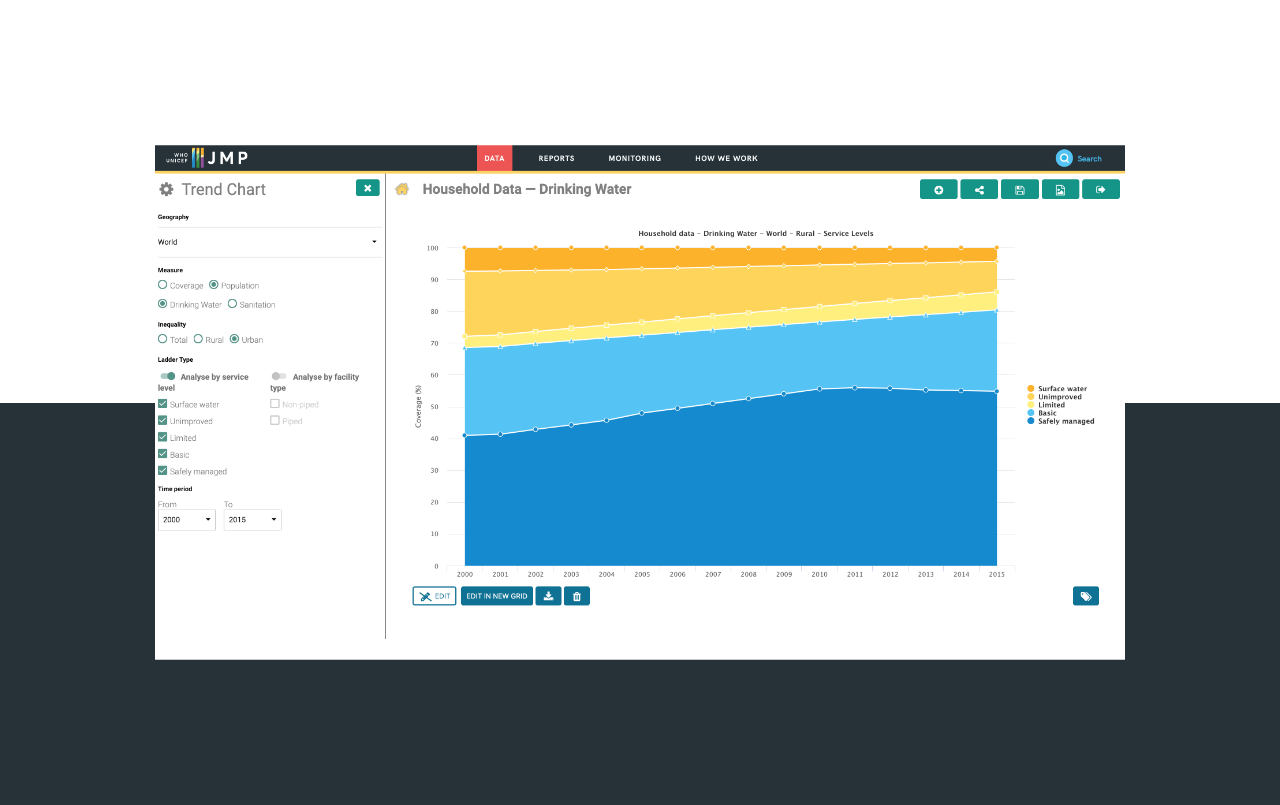
Washdata renders the complex data both useful and accessible. JMP users are now able to interact with the tool in a number of ways: Hovering over countries on a world map brings up relevant information country-by-country; the site also contains numerous charts and graphs which bring the statistics to life; researchers have the ability to customise these charts according to multiple variables, depending on what they are studying; and users can then download and print charts and data in either pdf or csv format.
Later in the project, we created a help page and screencasts to help users make the most of the site. This level of support makes the site more user friendly, increasing potential impact.


The Tech
We built the backend using the PHP framework Symfony 2. The interactive charts were built as a single-page Angular JS application using Highcharts, which sourced the relevant imported data via an API. The map is based on Google Maps, with shape data for each country overlaid on this.
We ran user testing to decide on the best types of charts for the data. The types of charts used include ladder charts, inequality line graphs (which show how access to water and sanitation changes over different wealth quintiles of the population), rank charts, bar charts and trend charts.
Shaping the data to fit each of these formats provided a truly worthwhile challenge to our designers. We worked closely with the client to iron out anomalies in the data and to make sure that we understood their complex filtering requirements.
The Impact
Following the relaunch, site visits and sessions increased by 30%.
We are proud to have delivered a high functioning and accessible tool that will lead to real global impact.

Moving Forward
JMP fieldworkers constantly collect data, and so we frequently import new data into the site to keep it relevant. While the initial phases used household data only, the site now contains data collected from schools and healthcare facilities, giving even more robust indicators of global health and development.
We continue to work with the JMP and Agile Collective on this project. So far, the site is still largely aimed at user groups with niche knowledge of the field (academics, NGO workers, etc). We hope in the future to make the data even more accessible so that Washdata becomes useful to the general public. The United Nations JMP project shows how two CoTech teams can work perfectly in parallel, each to their own strengths. At Outlandish we work to foster such relationships, and are always on the lookout for future partners.
“I think it looks great and is all working very well for me. Many thanks to all the team for all your hard work pulling it together just in time.”
Tom Slaymaker, Sr. Statistics and Monitoring Specialist, Unicef
“That was an amazing piece of project, client and team management on your part. The result is absolutely excellent.”
Jim Noble, Member and Project Manager, Agile Collective [CoTech partners on this project]


